

Introduction
Primary aluminum production in the United States has undergone significant changes between 2010 and 2023, driven by energy costs, environmental policy, global demand, and competition from imports. Understanding this production trend is crucial for industries relying on aluminum tube, aluminum sheet, aluminum bar, and aluminum coils, as shifts in domestic output can affect pricing, supply stability, and investment decisions.
Overview of Production Trends (2010-2023)
From 2010 to 2023, U.S. primary aluminum production has gone through ups and downs. Key milestones include:
- 2010-2012: Relatively stable production with modest growth as global demand recovered following the 2008 financial crisis.
- 2013-2016: Decline in smelter operations, due to rising electricity costs in several states and aging plants shutting down or reducing capacity.
- 2017-2019: Some rebound, particularly as policy incentives and trade adjustments (e.g. import tariffs) offered support to domestic producers.
- 2020-2023: Further volatility from COVID-19 supply chain disruptions, energy price spikes, and increasing push for low-carbon aluminum.
According to the U.S. Geological Survey (USGS), primary production in metric tons shifted notably—showing both contraction and recovery phases across this period.
Factors Driving Changes in Primary Aluminum Production in the United States
Several forces have shaped primary aluminum production in the United States between 2010 and 2023:
- Energy Costs & Policy
Aluminum smelting is energy-intensive. Electricity rates and access to hydro or renewable power sources significantly impact profitability. States with higher energy prices saw smelter closures. - Environmental Regulations
Stricter emissions rules (e.g. greenhouse gases, fluorides) increased operating costs. Compliance led to closure of older, inefficient plants and investment in modern, cleaner tech. - Trade Tariffs & Import Competition
Imports of primary aluminum and semi-finished products (sheet, coils, bar, tubes) exposed domestic producers to global competition. Policies such as Section 232 tariffs in 2018 attempted to shield domestic production, influencing investment decisions. - Global Aluminum Prices
Prices on international markets (e.g. London Metal Exchange) heavily affected profitability at home; periods of high commodity prices coincided with uptick in domestic output. - Demand from Downstream Industries
Rising demand for aluminum sheet in packaging and construction, aluminum coils for infrastructure, aluminum tube and aluminum bar in automotive and aerospace pushed for more supply—but domestic production capacity didn’t keep up fully.
Quantitative Trends & Data Highlights
Here are numeric snapshots to illustrate how primary aluminum production in the United States changed over time:
| Year | Approx. Production (million metric tons) | Notable Events |
|---|---|---|
| 2010 | ~1.9 million tons | Stable post-recession demand |
| 2014 | ~1.6 million tons | Energy cost spikes; plant retirements |
| 2018 | ~1.8 million tons | Section 232 tariff influence |
| 2020 | ~1.5 million tons | COVID impacts; logistics issues |
| 2022 | ~1.7 million tons | Demand resurgence; energy challenges |
| 2023 | ~1.75 million tons | Growth in green aluminum, incremental capacity restorations |
Data source: U.S. Geological Survey – primary aluminum statistics.
These numbers show that while there has been recovery, production has not vastly outpaced historical peaks, leaving gaps that imports must fill—especially for aluminum coils, aluminum sheet, aluminum tube, and aluminum bar.
Implications for Key Aluminum Products
The fluctuations in primary production have downstream consequences:
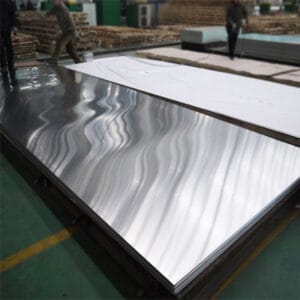
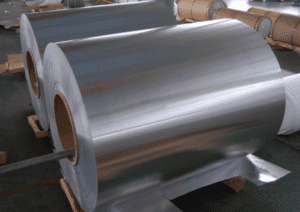
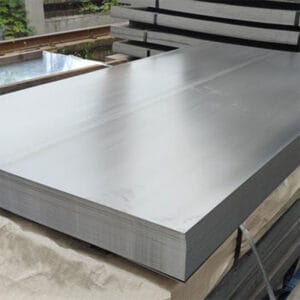
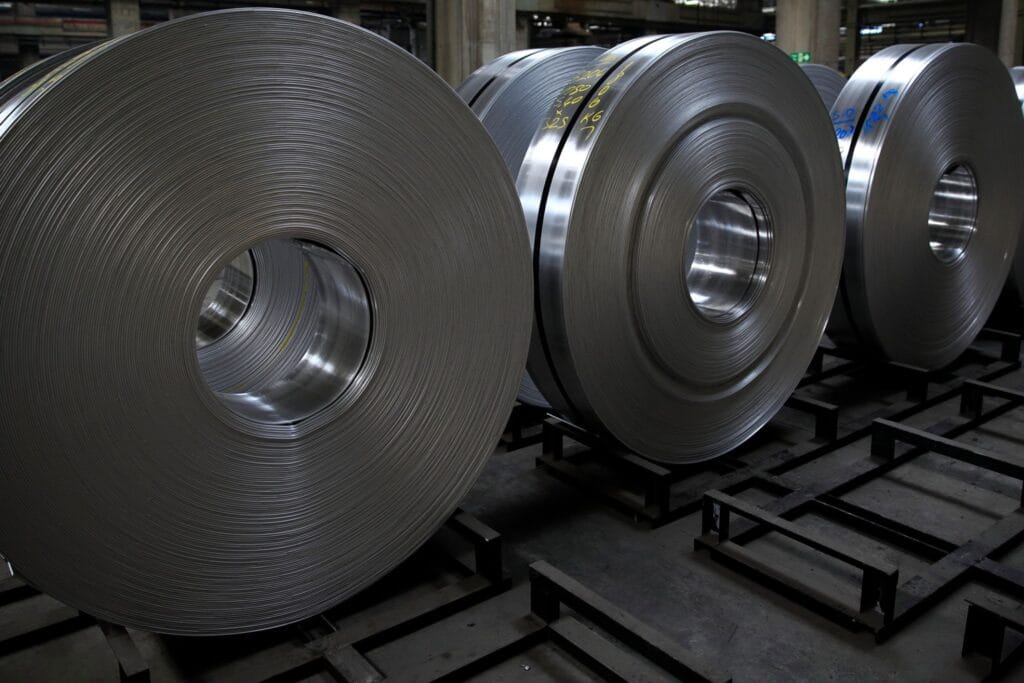
- Aluminum Sheet & Coils: These semi-finished forms are crucial for packaging (food, beverages), construction roofing & siding, and industrial cladding. When domestic primary production dips, imports of sheet and coils spike, raising prices for goods like roofing panels and canned products.
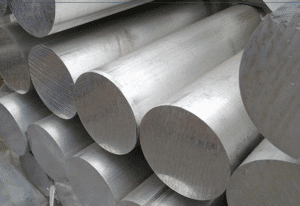
- Aluminum Tube & Aluminum Bar: Demand grows in automotive, aerospace, and machinery sectors. For structural parts or frames, quality and alloy consistency matter; domestic shortfalls influence reliance on imports, lead times, and cost.
Regional & State-Level Factors
Certain U.S. states play outsized roles:
- States with access to low-cost hydroelectric power (e.g. Washington, Oregon) tend to support more stable smelter operations.
- Regions with high energy costs or regulatory burdens (e.g. parts of the Southeast) found it harder to maintain older smelters without modern upgrades.
- Investments in renewable energy and incentives for low-carbon aluminum production have begun to shift smelters toward cleaner power supplies, affecting where new capacity or retrofits are viable.
The Role of Recycling & Secondary Production
While primary aluminum production in the United States is essential, secondary production (from recycled scrap) has been rising in importance:
- Secondary aluminum uses roughly 5‐10% of the energy required for primary production.
- Scrap sources include used beverage cans, end-of-life vehicles, and construction waste.
- Increased recycling helps buffer supply when primary production dips—especially for products like aluminum sheet and aluminum coils.
However, recycled aluminum cannot fully replace primary forms, especially for high-strength aluminum bars or aerospace-grade aluminum tubes, where material purity, consistent alloy properties, and structural capacity matter.
Future Outlook (Post-2023 & Beyond)
Looking beyond 2023, several trends are likely to influence primary aluminum production in the United States:
- Green Production Pressure: Buyers (in auto, packaging, construction) demand lower carbon footprints. Smelters that can operate with clean electricity will be more competitive.
- Technological Innovation: New smelting technologies, more efficient reduction cells, and better recycling techniques will reduce costs and environmental impact.
- Policy Incentives: Government subsidies or tax credits for clean aluminum, renewable power, and infrastructure spending could stimulate new primary production, or at least encourage refurbishing older plants.
- Global Supply Chain Shifts: Trade disruptions or supply chain sensitivities (e.g. due to geopolitical risk) will make secure domestic production more attractive.
- Demand Growth in High-Grade Forms: Products like aluminum tubes for EV powertrains, aluminum bars for structural applications, and premium aluminum sheet/coils for architectural applications will push for higher quality, domestic or close-by sources.
What This Means for Businesses and Stakeholders
For manufacturers, investors, policymakers:
- Track energy policy and power pricing in potential smelter locations.
- Consider forming partnerships or investments in smelters using renewable energy.
- For downstream users of aluminum sheet, aluminum coils, aluminum tube, and aluminum bar, maintain diversified sourcing strategies.
- Monitor international competition: imported semi-finished forms may undercut domestic production if foreign producers have lower energy, less regulatory cost.
Conclusion
Overall, primary aluminum production in the United States from 2010 to 2023 has shown resilience in face of many challenges—energy costs, environmental regulation, market competition, and demand fluctuations. But production alone has not fully closed the gap between supply and demand.
For industries dependent on aluminum tubes, aluminum coils, aluminum sheet, and aluminum bar, this means balancing domestic sourcing with imports, investing in recycling, and keeping tabs on policy and market shifts.
The period 2010-2023 suggests that while progress has been made, there remains significant opportunity for growth in domestic primary production—especially in cleaner, more energy-efficient plants that can compete globally.